
How to Turn Your Metrics into a Product Growth System
Build a Metrics Tree That Actually Moves the Product Forward

Hey, Dmytro here — welcome to Atomic Product.
Every week, I share practical ideas, tools, and real-world lessons to help you grow as a product thinker and builder.
If you're new here, here are a few past posts you might find useful:
Hit subscribe if not on the list yet— and let’s roll 👇
When you’re just launching a product — you want to track everything.
When your product starts growing — you want to track even more.
And then one day you open your dashboard… and realize:
You have no idea which of these numbers actually matter — and which ones just look nice and flashy.
It’s not an analytics problem. It’s not because you forgot to set up GA4 or didn’t integrate Amplitude. 👉 It’s because you don’t have a metric tree.
— Sounds like yet another buzzword, like AARRR or HEART?
— Nope. It’s something entirely different.
Today we’ll fix the chaos.
We’ll walk through how to bring clarity to your metrics,
how to track less but understand more,
and how to build your own metrics tree — tailored to your product, your stage, and your real goals.
We’ll use our fictional product NutriTrack [from this case study: How to Solve an 80% Drop-Off in a Mobile App] as a hands-on example.
Step by step — from the North Star to the smallest behavior metric.
With formulas, examples, and mistakes you’ll want to avoid.
Let’s get into it.
What is a Metrics Tree — and Why You Need One
A metrics tree is a way to connect your business goals to measurable, actionable product metrics.
It’s a structure — not a dashboard.
It shows how things are connected, not just how they’re doing.
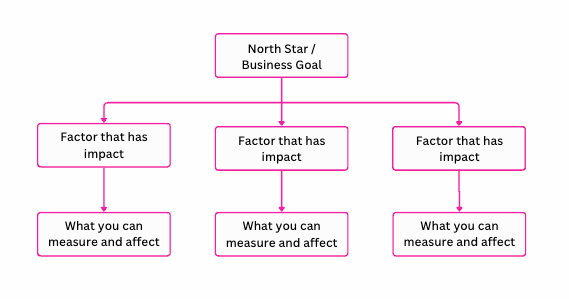
Imagine it as a hierarchy:
At the top: a North Star or goal-level metric that defines product success
In the middle: key drivers that influence it
At the bottom: metrics you can actually measure and act on — today
This isn’t about “tracking everything.”
It’s about understanding what’s worth tracking — and why.
🔍 A quick example:
Goal: We want users to come back.
Metric: Retention 7 day
What influences it?
– Did they get value fast?
– Did they return on Day 2 or Day 3?
– Did they see a reminder?
– Was there a reason to come back?
→ So under Retention we add:
First Value Rate, Push Open Rate, Weekly Return Rate, and so on.
That’s your tree.
It’s not about beautiful dashboards — it’s about seeing what really drives your product forward.
🛑 What happens when you don’t have a metrics tree?
You’re looking at nice graphs — but can’t answer: “Are we actually growing?”
Different teammates look at different numbers — and pull in different directions
You optimize numbers that… don’t matter
(like MAU going up while retention and revenue tank)
There’s No Such Thing as a Universal Metrics Tree — And That’s Okay
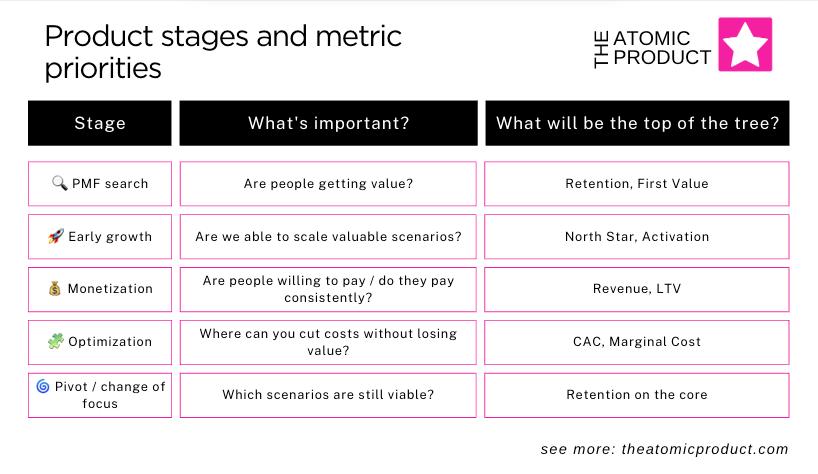
Every product goes through different stages.
And at each stage — different goals matter.
And for every goal — you’ll need a different set of metrics.
That’s why:
you can’t just grab a “Top 10 startup metrics” list and slap it onto your product,
and you can’t start by asking “What should we track?” —
You should start with: “What matters to us right now?”
🧪 Let’s make it real: Where is NutriTrack right now?
Quick recap:
NutriTrack is a fictional product we introduced in the case study “How to Solve an 80% Drop-Off in a Mobile App”.
It helps users track meals and build healthier eating habits.
🔬 As of now:
it’s just starting to acquire users,
it’s not monetized yet (revenue comes later),
and it’s suffering from massive early-stage churn.
👉 So the main question we’re trying to answer is:
Are we delivering enough value to make users stay?
💡 That means the top of our metrics tree shouldn’t be revenue or growth — it should be something like:
7-Day Retention, or even better — Sustainable Usage
→ Are people coming back intentionally — not just tapping the app out of habit?
🧭 But here’s the thing:
“Retain users” is not a strategy. It’s not even a metrics tree.
Next, let’s talk about how to define a proper North Star, then break it down into clear drivers, and how to tell which metrics you can actually influence — versus the ones that just sit there looking pretty.
How to Choose a North Star and Start Building Your Tree (Using NutriTrack)
Before you start building a metrics tree, you need to ask yourself:
Where is this tree even going?
In other words — what sits at the very top? And why?
What is a North Star Metric (NSM)?
In simple terms — it’s the one metric that reflects the core value your product delivers to users.
A good NSM should:
be tied to real usage, not vanity numbers like likes or clicks
reflect a repeatable and meaningful scenario
grow when your product genuinely gets better
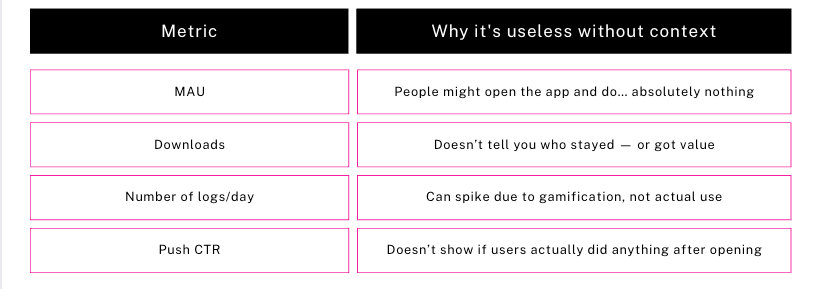
❌ Examples of bad North Stars:
MAU (Monthly Active Users)
→ Sounds impressive, but doesn’t tell you whether users are actually doing anything valuable.App downloads
→ Useless on its own — you can run a promo and get downloads with zero engagement.Number of food logs per day
→ Might look good, but fake or one-time logs don’t equal real value.
So what could be the North Star for our example (NutriTrack)?
Let’s think for a second:
What do we actually want from a user?
Not just to download the app — but to keep coming back and use it for something real.
💡 That leads us to a possible NSM for NutriTrack:
“Number of users who come back 3+ times per week for at least 3 consecutive weeks.”
Why this works:
It shows repeat usage → a sign of perceived value
It reflects sustained behavior, not just random taps
It’s measurable — using event logs or analytics
Now let’s figure out what influences this NSM.
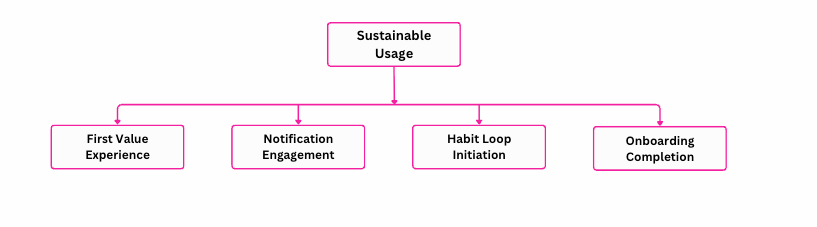
Breaking the NSM into Drivers (Level 1 of the Tree)
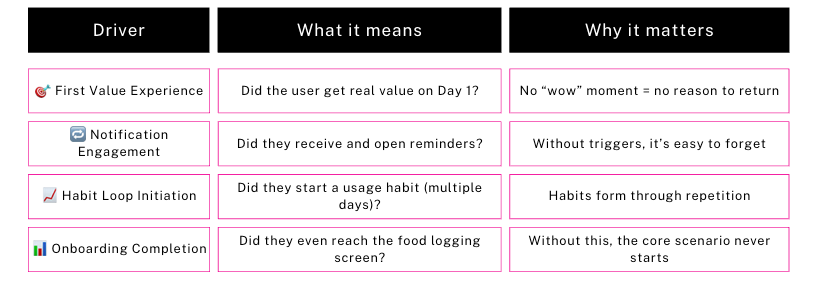
Practical formulas for these drivers
First Value Rate = % of new users who log their first item on Day 0
Notification Open Rate = % who opened a push notification within the first 3 days
Habit Loop Init = % who used the product on 3+ consecutive days in Week 1
Onboarding Completion = % who finished all onboarding steps
This gives us the first full level of the tree — a direct connection between the North Star and the key drivers that push it forward.
Going Deeper: From Driver to Action
We’ve defined one of NutriTrack’s key NSM drivers:
First Value Experience —
Did the user get that first meaningful win that makes them want to come back?
Now it’s time to break that driver down.
Not just say “value matters” — but actually figure out:
where the value delivery breaks — and what we can do about it.
How does a user actually get value in our example (NutriTrack)?
Before you track anything, you need to map out the real user journey, not just the numbers.
In our case, the flow might look like this:
User opens the app
Starts onboarding
Reaches the food logging screen
Logs their first meal
Sees a chart or feedback
Thinks, “hey, this is actually useful”
Comes back the next day
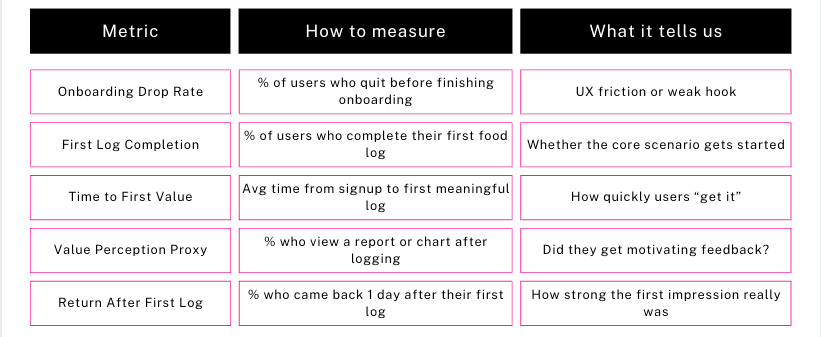
What can we measure along this journey?
💡 Heads up:
Everything below the first level of your tree isn’t just numbers —
these are signals you can use to improve the product.
A quick example: Turning metrics into actions
Let’s say you notice:
First Log Completion is low
→ Maybe the logging flow is too confusing or tedious.Value Perception Proxy is near zero
→ Users don’t see the benefit right away.
→ Try auto-generating insights or visual feedback.Time to First Value is too high
→ Consider cutting onboarding steps or surfacing the CTA earlier.
👉 That’s the whole point of a metrics tree:
To help your team figure out where things break — and what’s fixable.

📌 A few key rules when going deeper:
Every level should logically connect to what’s above it
→ If a metric doesn’t push the NSM, cut it.Metrics should be actionable
→ If you don’t know what to do when it drops — it’s not useful.Better to track 5 real metrics you act on
than 20 pretty ones you ignore.
Vanity vs Actionable: Which Metrics Actually Matter
Worse than not tracking metrics at all?
Tracking everything — and thinking that more numbers = more control.
But not all metrics are equal. Some tell you what’s really happening in your product.
And some… just look good on a slide.
What are vanity metrics?
Vanity metrics are the ones that:
go up on their own (thanks to ads or seasonality)
say nothing about real user value
and most importantly — can’t be influenced by the product team
Common examples of vanity metrics:
So what are actionable metrics?
These are metrics that:
are tied to user behaviors you can improve,
give you a reason to form hypotheses,
and can change when you change the product.
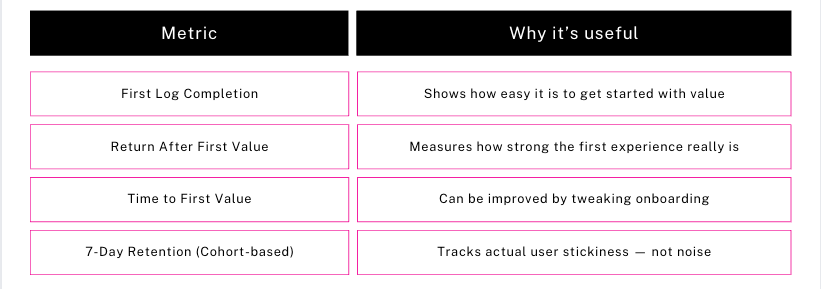
Examples of actionable metrics:
How to tell the difference?
Here’s a quick checklist:
✅ Can your team actually influence it?
✅ Will it change if you test something?
✅ Does it reflect real behavior — not just totals?
✅ If it drops — will you know why and what to do?
If the answer is no — chances are, it’s vanity.
💬 A quick real-life example:
You see your MAU has jumped. Nice!
But… retention hasn’t moved.
Neither has LTV.What happened?
→ You just bought a bunch of empty traffic.
Still looks great in the report, though!
⚠️ Bottom line:
Vanity metrics feed your ego.
Actionable metrics help you make decisions.
So when you’re building a metrics tree:
If a branch leads to vanity — cut it off.
How to Build Your Own Metrics Tree — A Step-by-Step Checklist

So, you’ve mapped your North Star.
You’ve broken it into drivers.
You’ve gone deep enough to turn metrics into actions.
Now what?
That’s where OKRs come in.
If your team is writing quarterly goals and they have nothing to do with your metrics tree —
your metrics are just sitting there, disconnected from reality.
So before we wrap, let’s make sure your tree actually works for you.
✅ Quick Checklist: How to Build a Metrics Tree That Doesn’t Rot
Start with your product stage
PMF, growth, monetization?
→ Your stage defines your North Star.Frame a question that really matters
Not “how’s our dashboard doing?”
→ Ask: “Are we delivering value that keeps people coming back?”Pick your North Star Metric
Can you measure it?
Does it reflect real, repeatable value?
Can you influence it through product changes?Break it into 2–4 key drivers
What behaviors directly move the needle?Drill down each driver into concrete behavior metrics
Keep it real. Use formulas, not just acronyms.Cut anything that’s vanity
If it looks good but tells you nothing — it goes.Link your tree to team goals (OKRs)
If you’re setting “retention” as a goal, and your drivers don’t touch First Value or onboarding —
something’s off.Update your tree every quarter or when focus shifts
Metrics are alive. Your tree should evolve with your product.
💡 Final Thoughts
A metrics tree isn’t a reporting structure.
It’s a thinking structure.
It helps you move from “hmm, what’s happening?”
to “we know exactly where things break — and what to do about it.”
It’s not about tracking more.
It’s about tracking less — and knowing exactly why.
Keep reading Atomic Product!
— Dmytro